
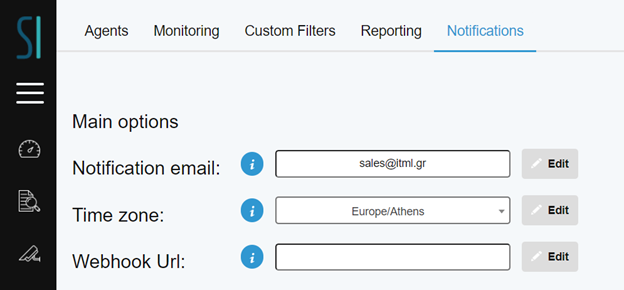
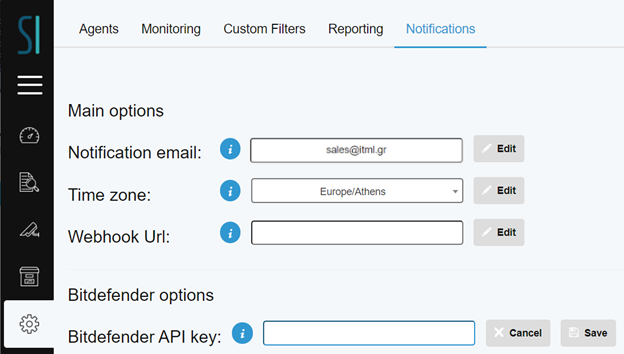
Go to Admin Panel → help.Notifications to set the “Notification email”. This is the email address set to receive all alerts from Security Infusion. You can also set the preferred timezone for the report scheduling. Moreover, you can setup a webhook for sending notifications to other apps such as Slack.
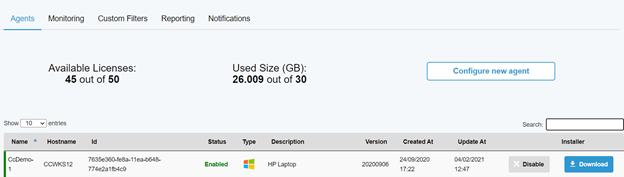
To enable a new agent configuration, go to Admin Panel → Agents. Select “Create new agent’, provide a name for the agent and type (windows or linux). After enabling a new agent, you can download the installation package and install it in the node you want to monitor. More information about agent installation can be found in the next section.
 Video Tutorial
Unzip the packaged installer, downloaded from Admin Panel → Agents.
The installation of the Security Infusion Agent requires elevated windows privileges (admin). If the logged-on user performing the installation does not hold such rights, a prompt will be shown requiring credentials of an account with admin rights. Depending on the Windows Operating system, the user may be presented with the User Account Control (UAC) screen.
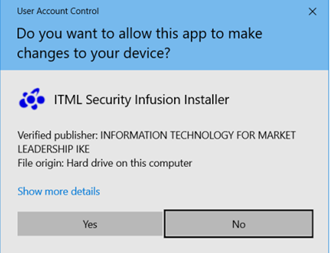
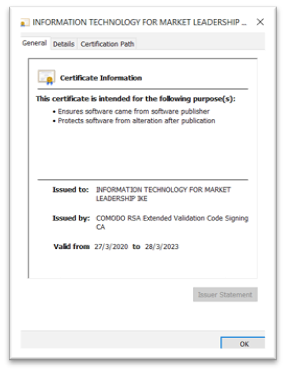
By clicking Show more details → Show information about the publisher’s certificates the information of the security certificate used to sign the installer is shown.
Note: For Windows 7 operating system the security prompt will state that the software publisher is “unknown”. This is due to the fact that Windows 7 support ended in January 2020 and therefore these systems lack the current Windows Root and Intermediate Certificates.
Security Infusion agent requires .Net Framework to be installed, with a version equal or greater of 4.6.1. If the installer detects that this requirement is not met then the message shown in Figure 6 appears.
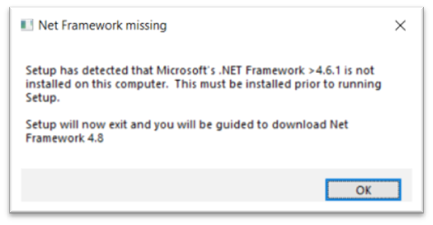
By clicking OK the installer exits and the web page is opened in the web browser to download .Net Framework 4.8. After the installation of the downloaded installation package the user may be prompted for a reboot. Furthermore, depending on the Windows Operating System type the installer will check if Windows Powershell version v4 is installed. If it is not found the user will be prompted with the screen shown in Figure 6 Windows Powershell 4 not found:
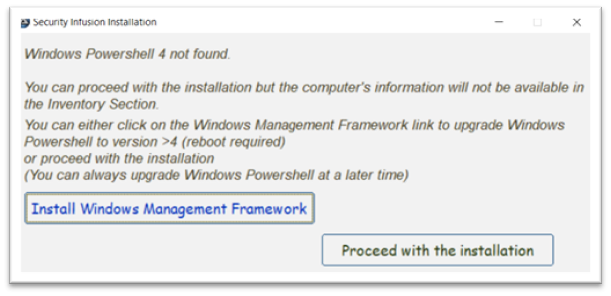
The user has a choice to:
The main interface screen of the installer is shown in figure below
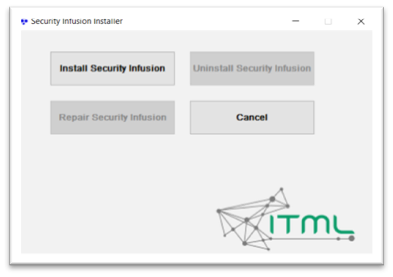
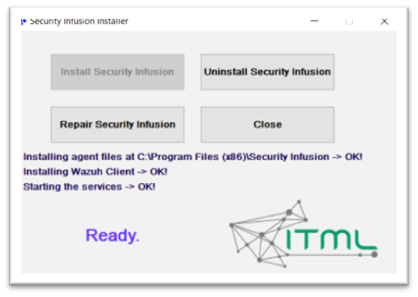
After the user clicks on Install Security Infusion the installation continues, informing the user about the intermediate steps taken. When completed the installation interface will prompt the user to click Close and exit the installer.
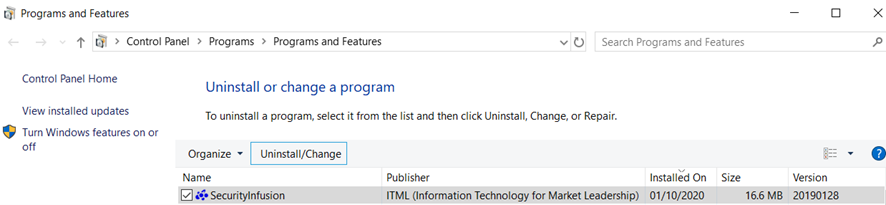
If the Security Infusion installer detects that the software is already installed the user will be given the choice to
Alternatively, the user can perform these options by doing so in the Add and remove programs Windows option.
Note: If any problems occur during the installation the user is advised to perform a repair installation.
The Security Infusion installer installs two windows services:
Additionally, a Windows Scheduled task Security Infusion Updater is created that will run once per day to check if an updated version of the Security Infusion agent is available. If an updated version is found the agent will proceed to self-update all installed components. If during this update the wazuh agent is updated a backup of its configuration (ossec.conf) will be backed up in the Security Infusion program folder renamed to contain the timestamp of the update.
After installing the windows agent, you can configure a set of parameters, located in:
%Program data path%/Security Infusion/WindowsAuditDService.exe.config
A typical installation path in a 64bit node would be: C:\Program Files (x86)\Security Infusion. The main configuration options of Security Infusion Agent are listed below.
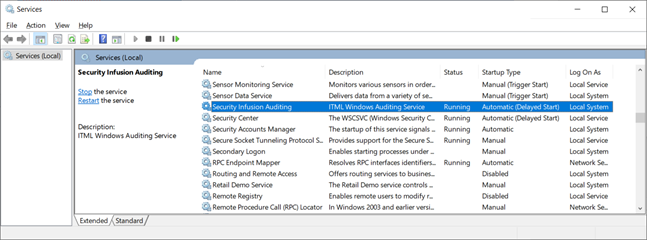
For changes to take effect, you need to restart the Security Infusion Auditing service.
| Main Parameters | Default value') }} | Description |
|---|---|---|
| SleepTime | 240000 | Time in milliseconds between active scans of system (collection and analysis of process list, open handles, DLLs, and open connections). The higher the value, the less frequent the active scans of the system are. |
| ListDllsEnabled | 1 | If ListDllsEnabled is set to “1”, then the agent retrieves the list of DLLs used by each process. This is a cpu-intensive task that can be disabled by setting ListDllsEnabled to “0”. |
| ProcMonEnabled | 1 | If ProcMonEnabled is set to “0”, the collected data (process list, open handles, DLLs, and open connections) will not be sent to the cloud. Only local analysis of these data is performed. |
| Monitored Service Parameters | Default value | Description |
|---|---|---|
| CPULoadWarning | 60 | CPULoad monitors CPU usage. IF CPU Usage (%) passes the CPULoadWarning threshold , a warning alert is set off. |
| CPULoadCritical | 95 | IF CPU Usage (%) passes the CPULoadCritical threshold , a critical alert is set off. |
| AvailableMemoryWarning | 500 | If available RAM is less than AvailableMemoryWarning MBs, a warning alert is set off. |
| AvailableMemoryCritical | 100 | If available RAM is less than AvailableMemoryCritical MBs, a critical alert is set off. |
| FreeSpaceWarning | 10 | If Free space In any of the available disks of the system is below FreeSpaceWarning %, a warning alert is set off. |
| FreeSpaceCritical | 5 | If Free space In any of the available disks of the system is below FreeSpaceCritical %, a critical alert is set off. |
To restart the service , search for the service called “Security Infusion Auditing” shown in figure below.
 Video Tutorial
Untar the packaged installer (by running in a linux shell: tar zxvf linux_agent.tar.gz), downloaded from Admin Panel → Agents. Run (as root) the centos-installer or ubuntu-installer, based on your linux distribution. To run the installation script, you need to have Java 1.8 or later installed. Moreover, for centos installations, docker is also required. The installer puts all new files in /var/secinfusion path. After installing the Linux agent, you can configure a set of parameters, located in /var/secinfusion/config.xml.
The Security Infusion installer installs two services:
The main configuration options of Security Infusion Agent are listed below. For changes to take effect, you need to restart the secinfusion service.
| Main Parameters | Default value | Description |
|---|---|---|
| SleepTime | 60 | Time in seconds between active scans of system (collection and analysis of process list, open handles, DLLs, and open connections). The higher the value, the less frequent the active scans of the system are. |
| ProcMonEnabled | 1 | If ProcMonEnabled is set to “0”, the collected data (process list, open handles, DLLs, and open connections) will not be sent to the cloud. Only local analysis of these data is performed. |
| Monitored Service Parameters | Default value | Description |
|---|---|---|
| CPULoadWarning | 60 | CPULoad monitors CPU usage. IF CPU Usage (%) passes the CPULoadWarning threshold , a warning alert is set off. |
| CPULoadCritical | 95 | IF CPU Usage (%) passes the CPULoadCritical threshold , a critical alert is set off. |
| AvailableMemoryWarning | 500 | If available RAM is less than AvailableMemoryWarning MBs, a warning alert is set off. |
| AvailableMemoryCritical | 100 | If available RAM is less than AvailableMemoryCritical MBs, a critical alert is set off. |
| LoadWarning | 1 | If load is above this threshold, a warning alert is set off. |
| LoadCritical | 3 | If load is above this threshold, a critical alert is set off. |
In the Admin Panel → Notifications tab, you can setup a mail address for receiving alerts. You can also set the preferred timezone for the report scheduling (Figure 12 Notifications tab in Admin).
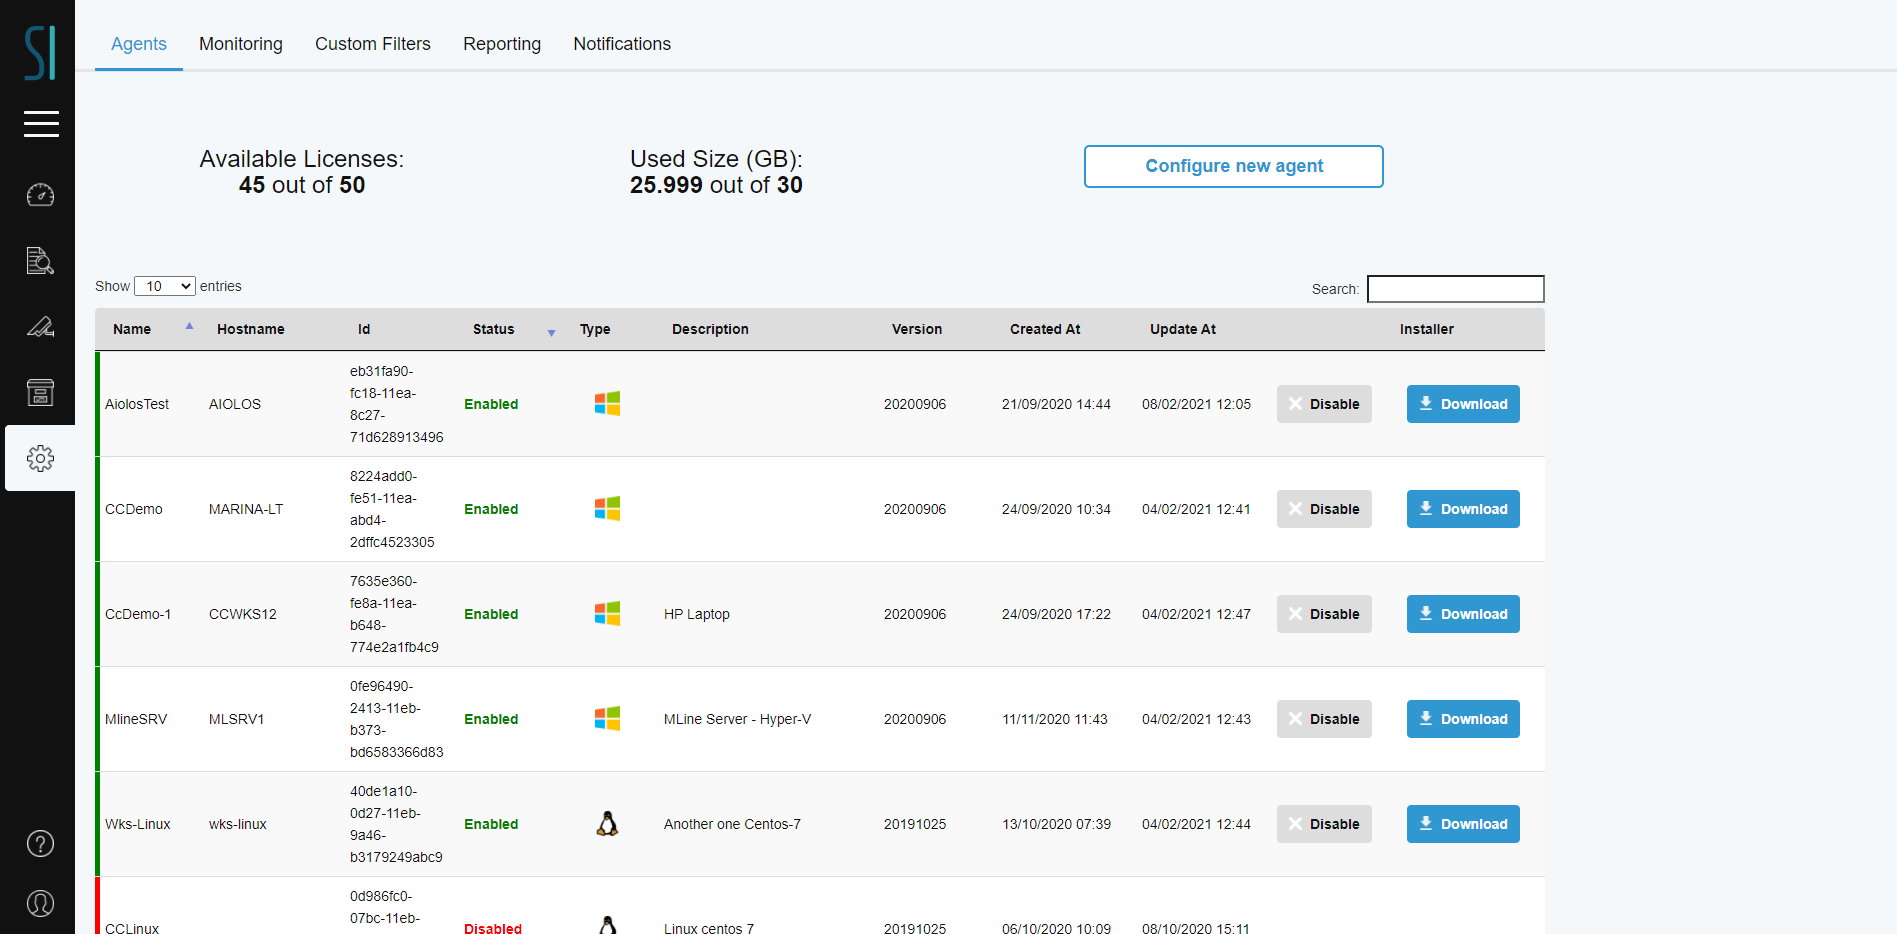
In the Admin Panel → Agents tab, you can check the remaining licenses, and enable/disable agents. You can also download the installation packages from this screen (Figure 13 Agents tab).
In Admin Panel → Monitoring tab (figure below), you can enable or disable email notifications for you agents. There are three types of notifications:
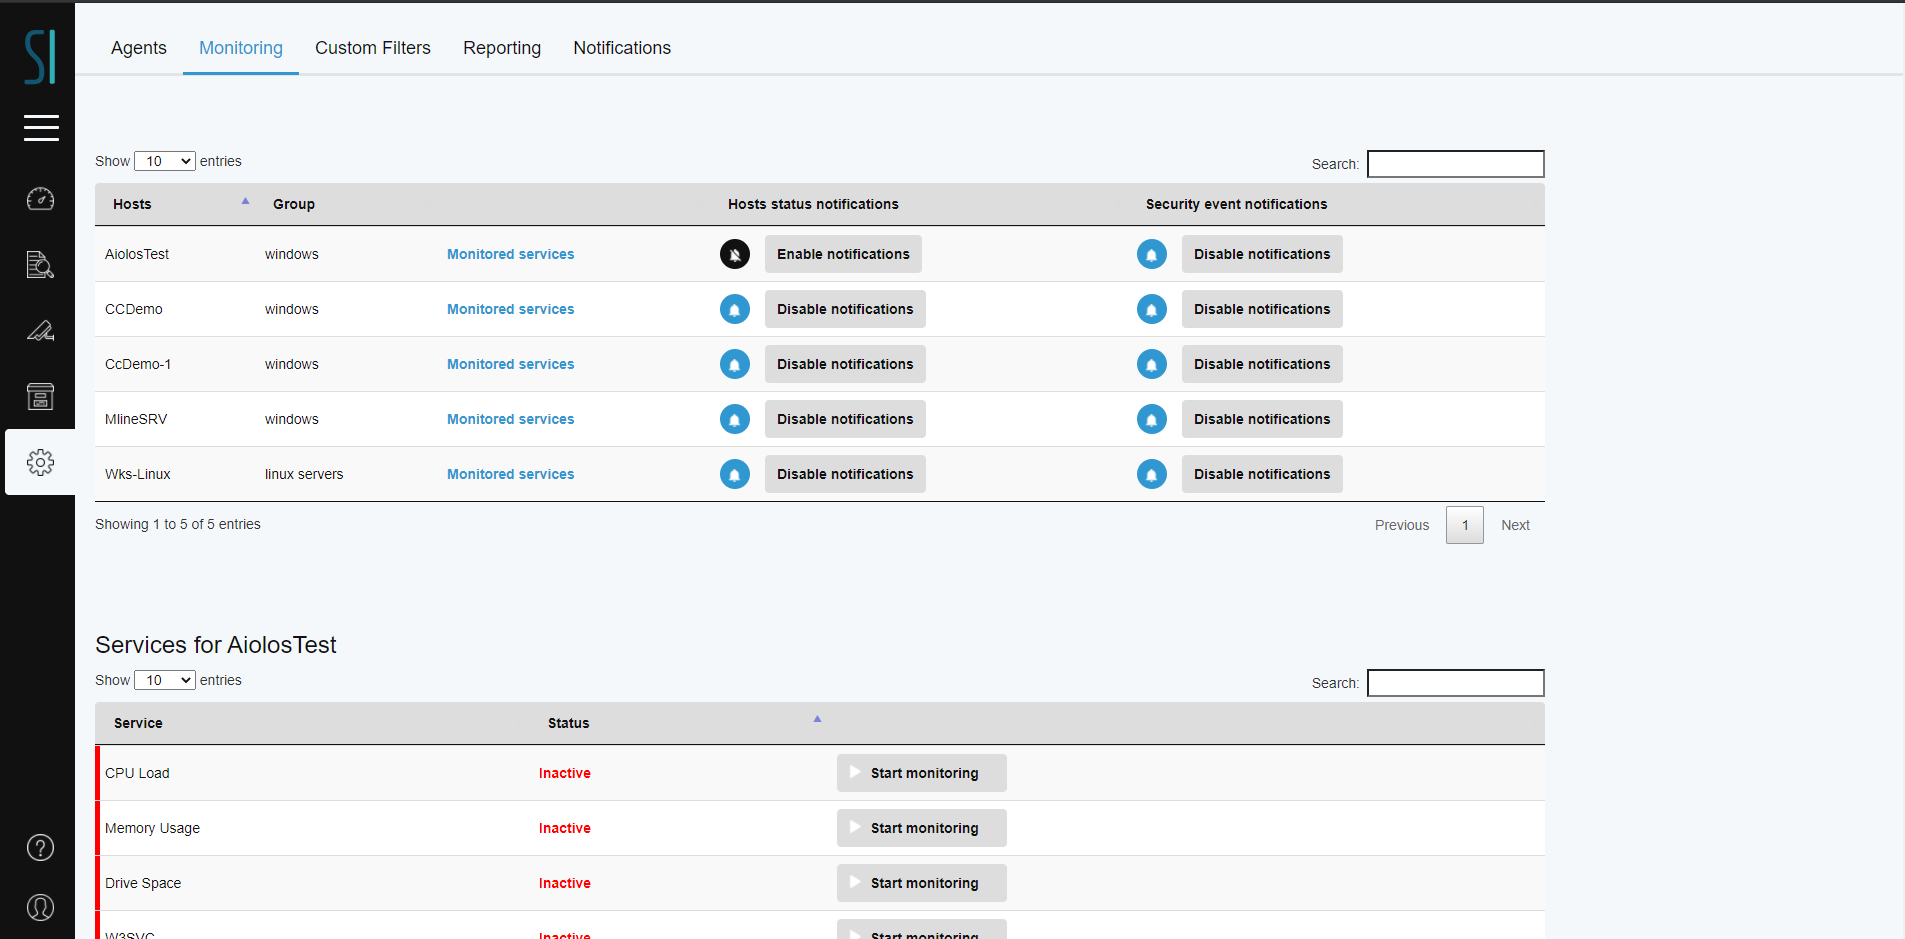
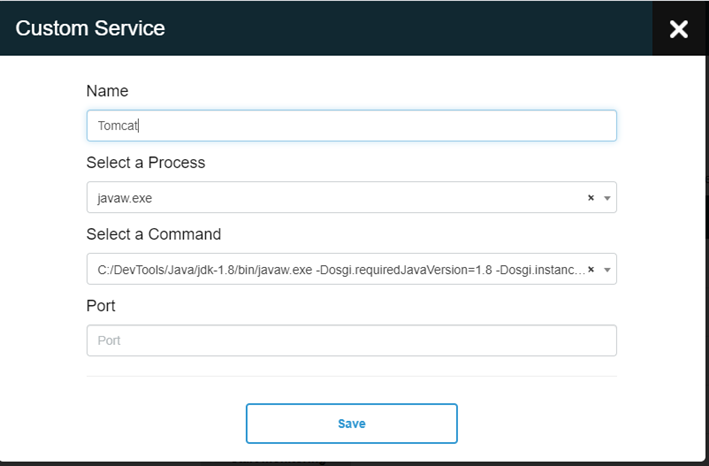
For every agent type, there is a list of predefined services that can be monitored. However it is possible to add any service by defining a combination of ( process, command path and port).The agent starts monitoring each service and reports its state back to the manager.
In the Monitoring tab, select “Add custom service” , add a service name of your liking and then fill at least one of the following fields:
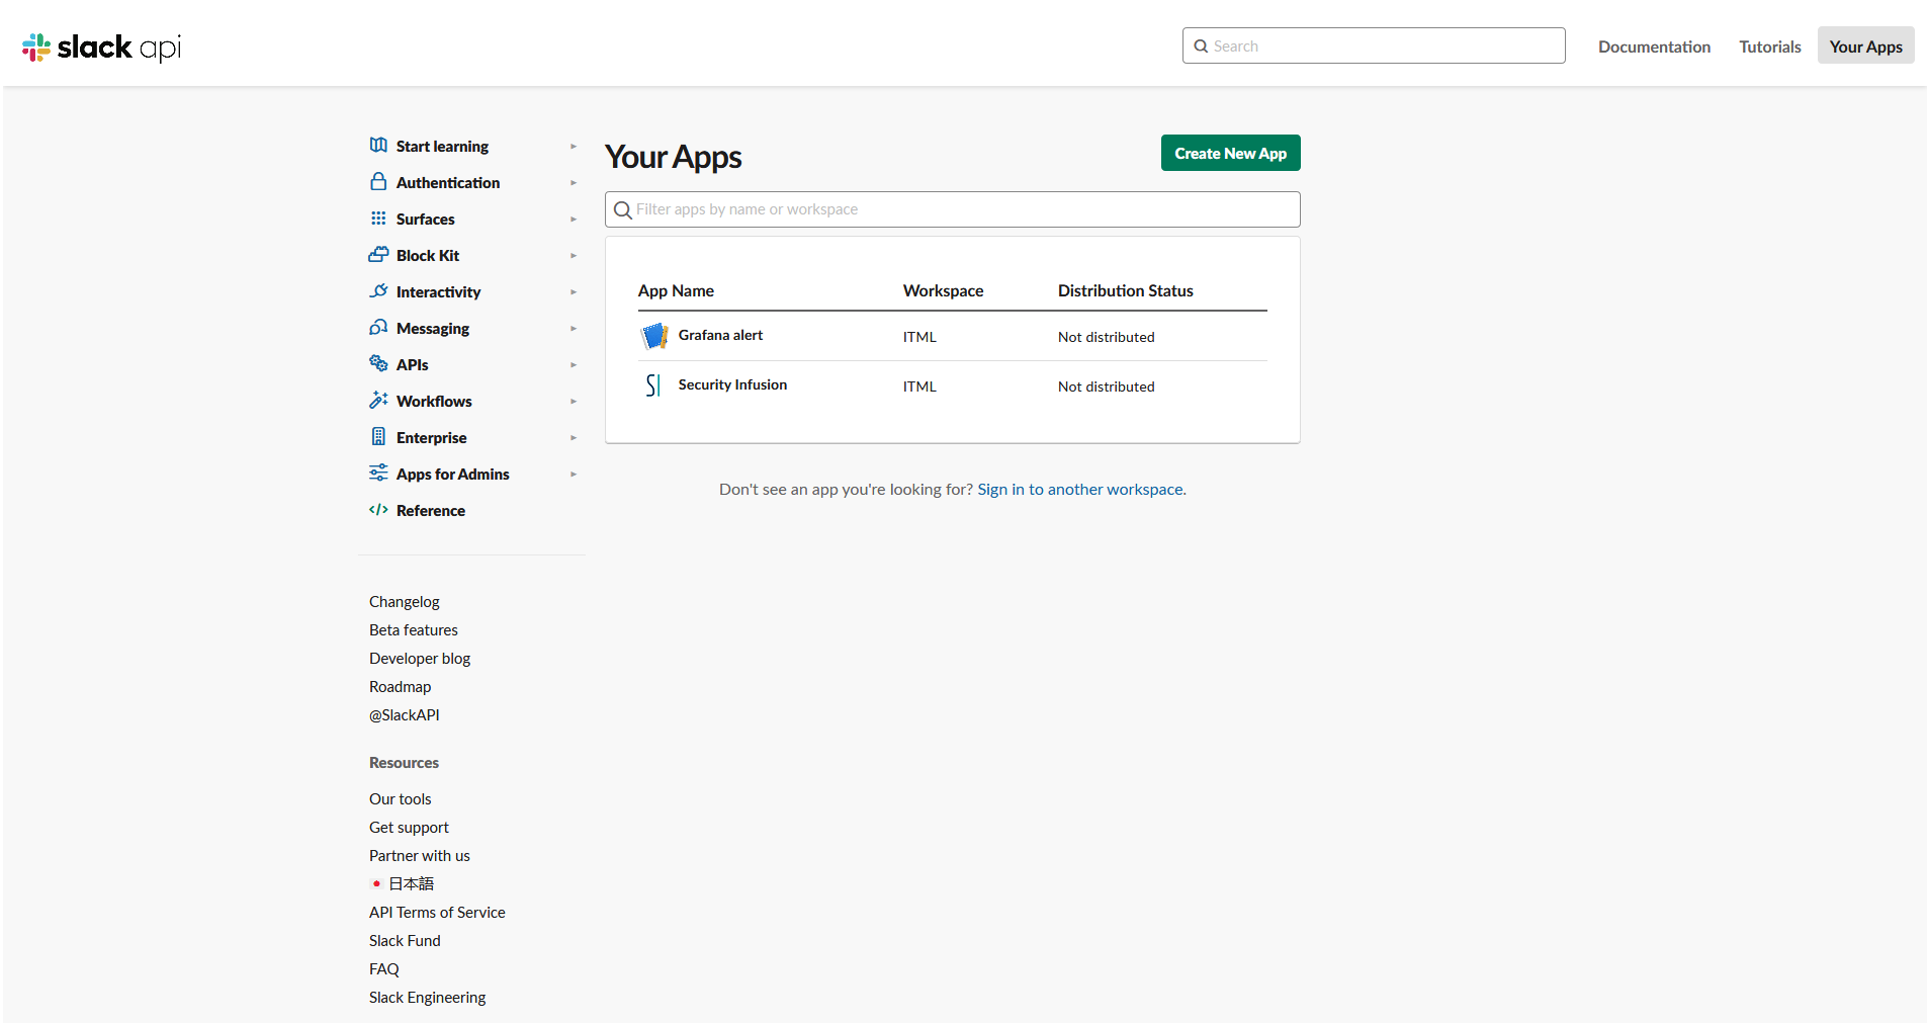
Head to https://api.slack.com/apps and click Create New App.
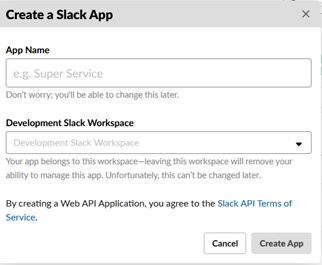
Fill in App Name and Development Slack Workspace and click Create App.
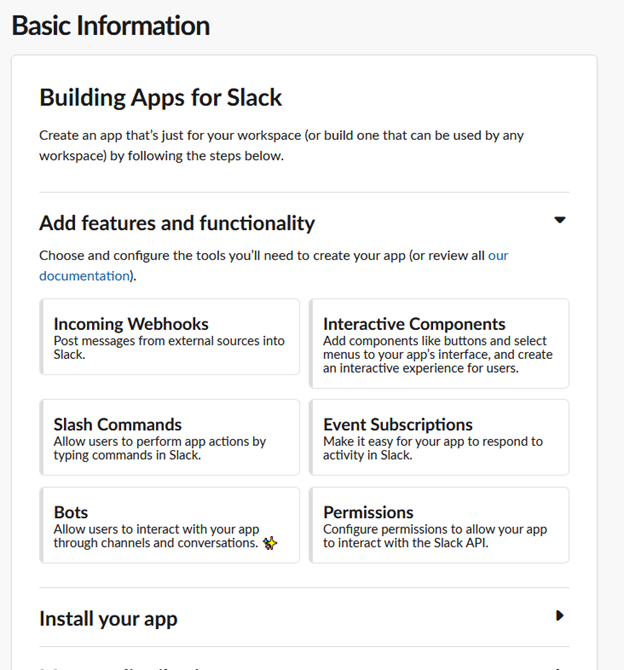
In the next screen you can edit your app, display info etc. Afterwards, click on “Add features and functionality” on the “Bots” tab.
Press the Incoming Webhooks panel and activate Webhooks by turning the switch to On. You will need to install the app on your Workspace selecting a channel for the bot to send messages to. After the installation step, on the webhooks page there is a webhook url on the bottom of the page.
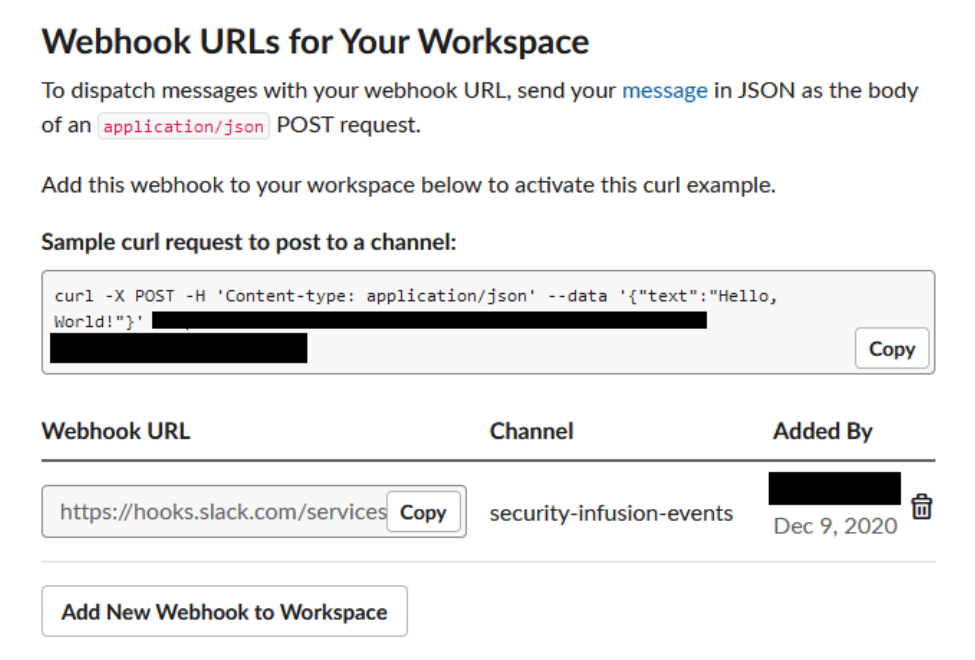
Click on Copy to get the url and head to the security Infusion webpage.
Fill in the webhook URL to get alerts.
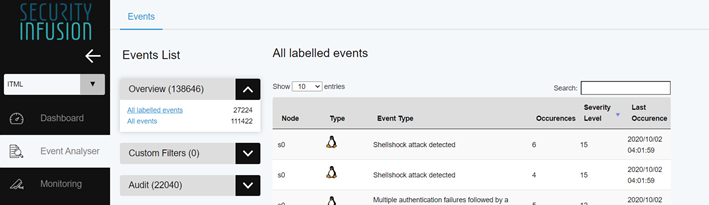
In the Event Analyser ( Available in the vertical menu), the user has the option to monitor the events from all nodes.
Select “All labeled events” option to retrieve aggregated events, categorized by type ( Audit , Security,Network etc) and node.
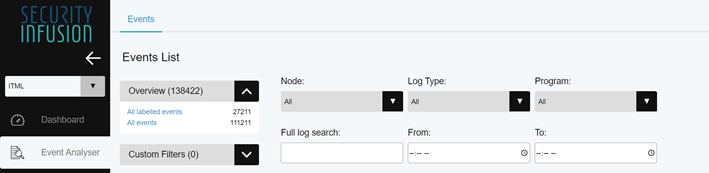
Select “All events” to get a feed of events, where you can filter by node, log type, program producing the event and time range. You can also do full text search by adding a specific term.
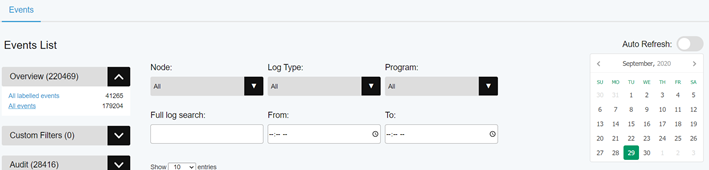
Both aforementioned options provide a live feed of data for the current day and are refreshed periodically. If you need to go back to a previous date, disable the auto-refresh option and select previous date from the calendar.
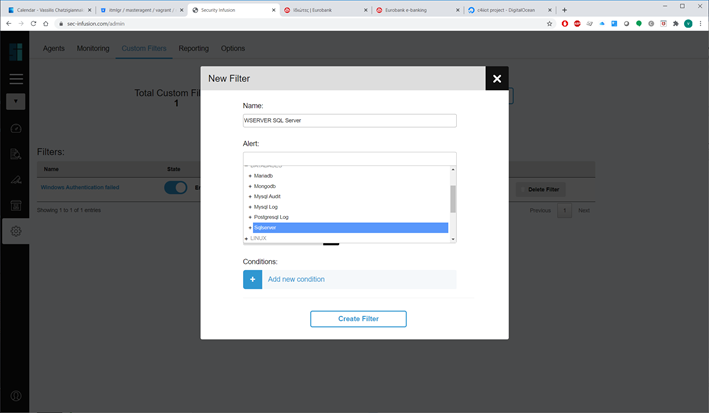
In Admin Panel → Custom Filters tab you can customize the notifications you receive for events that are of importance. Create a filter by selecting specific nodes, alert types, alert severity, or specific conditions (e.g. source IP, account name, etc.).
Enabled filters will be visible in the Event Analyser, under the “Custom Filters” section. This section is updated every few minutes with new events/alerts and also an email notification is sent when such an event is detected.
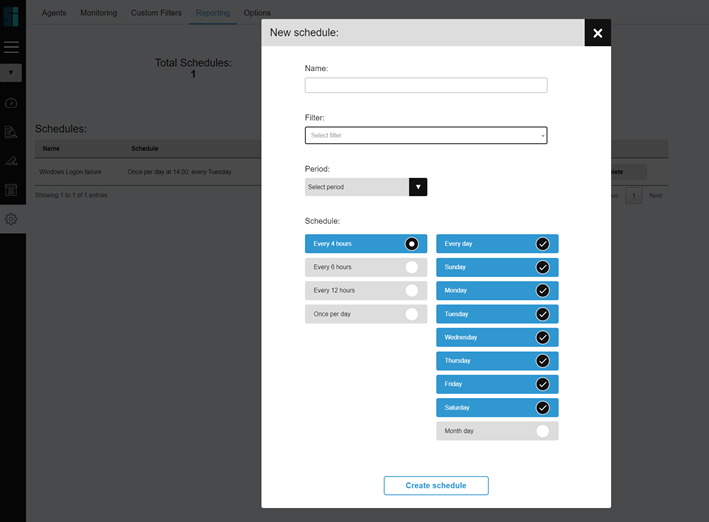
In Admin Panel → “Reporting” tab you can schedule the creation of reports. A report schedule is based on a pre-existing custom filter (that can be enabled or disabled) and a custom schedule. The reports are available for viewing online of downloading in the Reports section of the vertical menu.
Note: Make sure to download the reports, because they are available for only one month after their creation in the Manager.
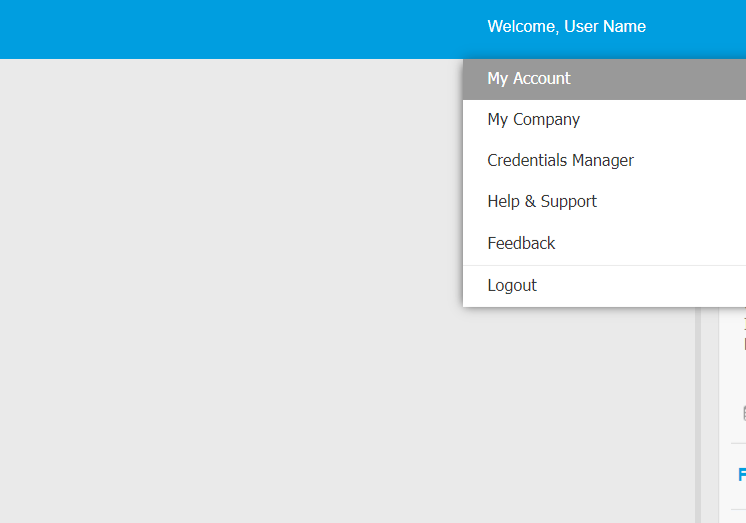
Go to the cloud console of Bitdefender and select the “My Account” option in the submenu under your name.
Go to API keys and create a new key, giving access only to the “Event Push Service API”.
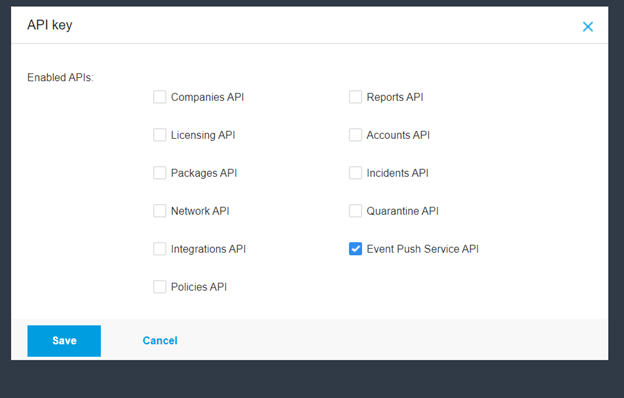
Copy the newly created key and go to https://security-infusion/admin, in the Notifications tab. Paste and save the key in the Bitdefender API key text box.
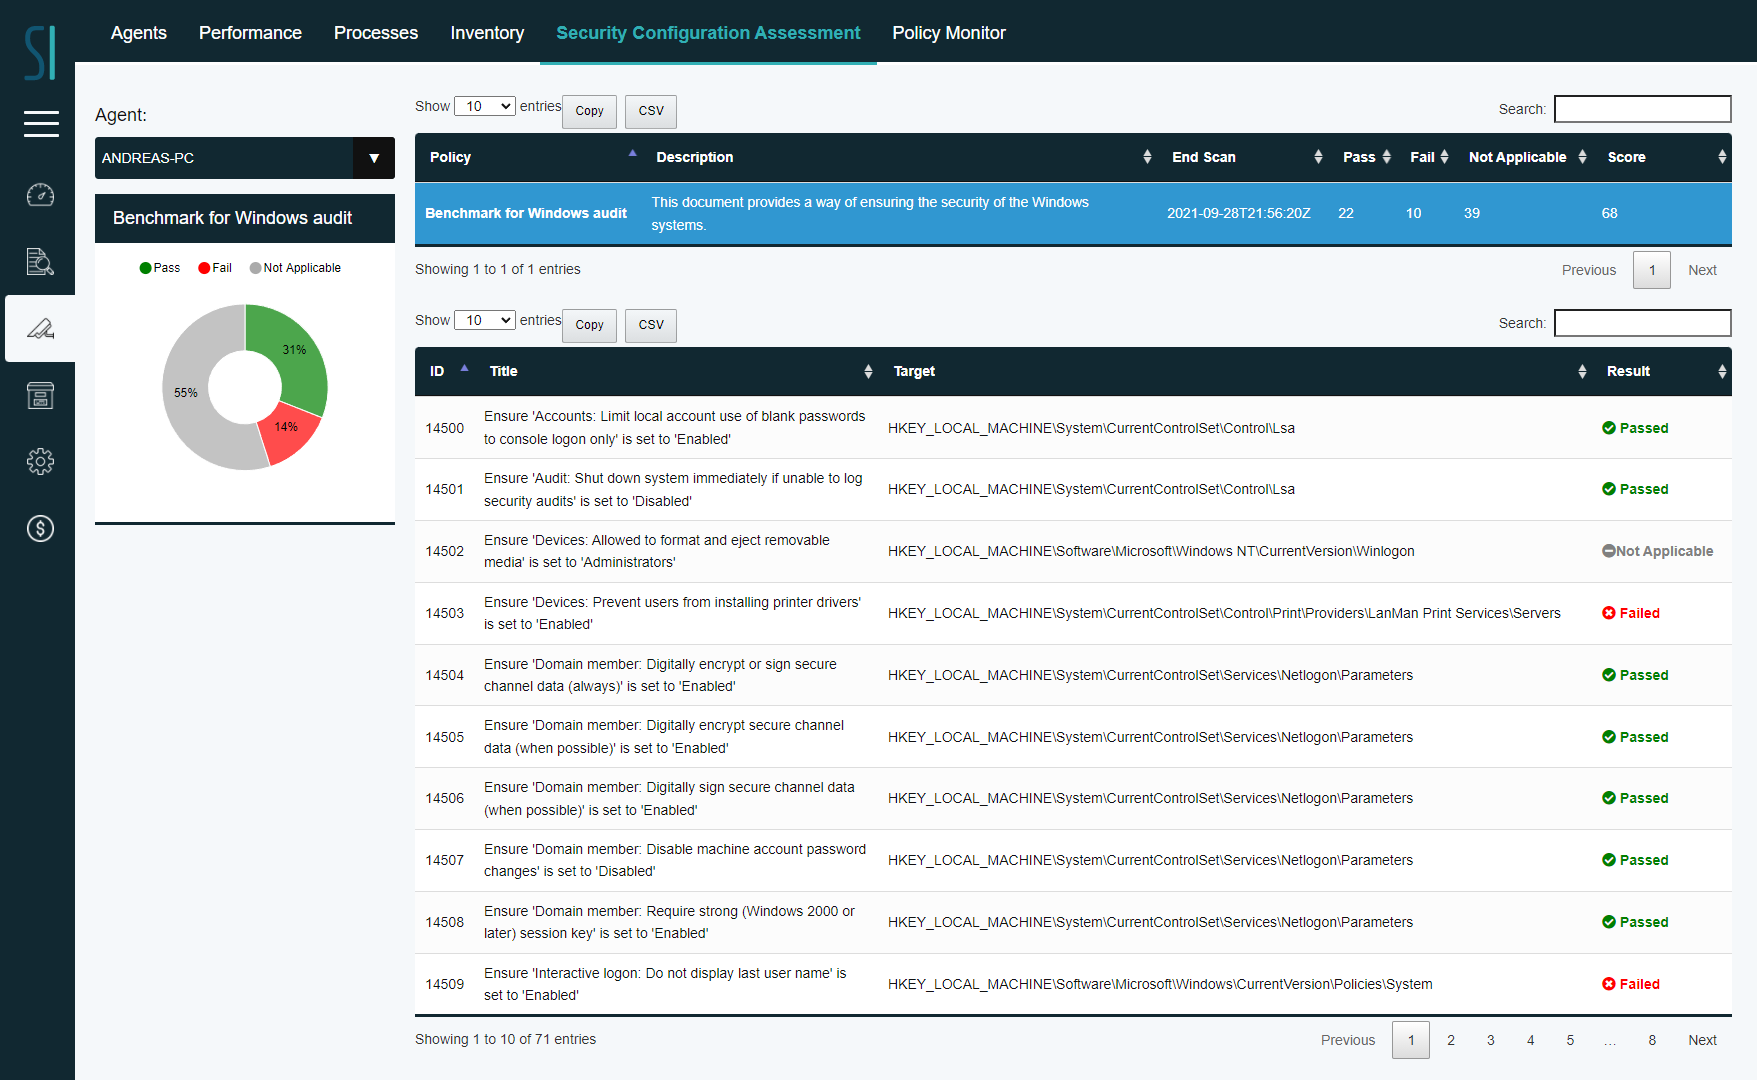
The SCA module provides an engine to interpret and run configuration checks. It has a set for predefined policies for Windows and Linux servers. An SCA policy is a group of configuration checks. These checks do use a rule, or a combination of rules, to verify the state of a system. Rules, among other things, can run custom commands, inspect configuration files and look for running processes or Windows registry keys.
Scans run periodically in every Security Infusion Agent. After a scan is completed, the agent reports to the results to the manager, and those become available in Monitoring - > Security Configuration Assessment.
Click on the Admin Panel Icon menu and select the Backup Tab.
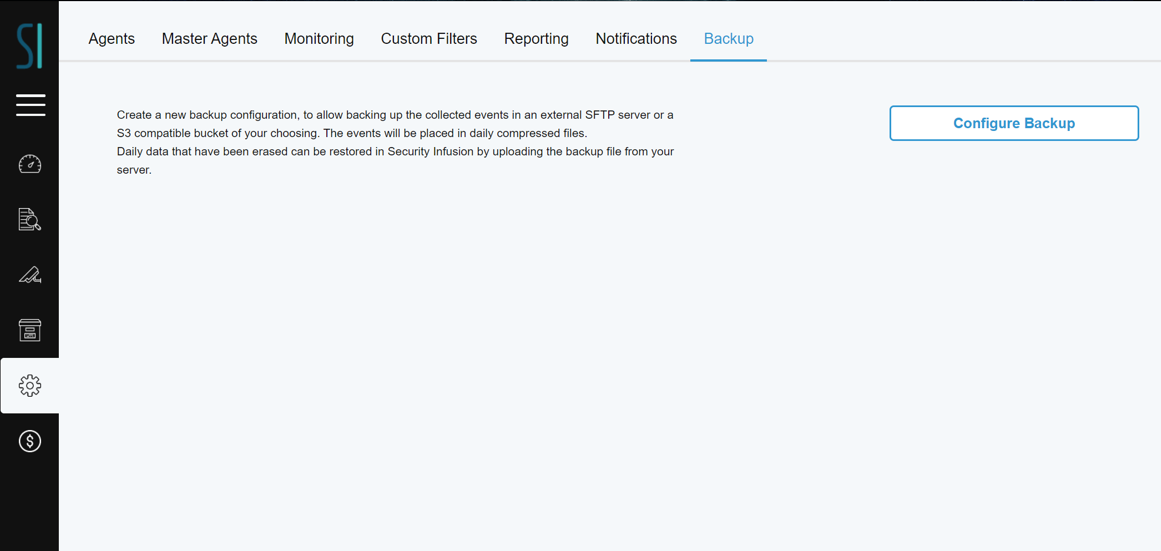
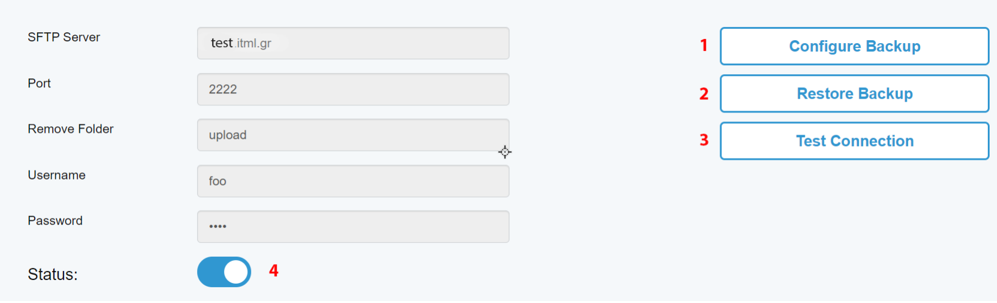
Click on the Configure Backup button and after selecting between SFTP or S3 type fill in the configuration details:
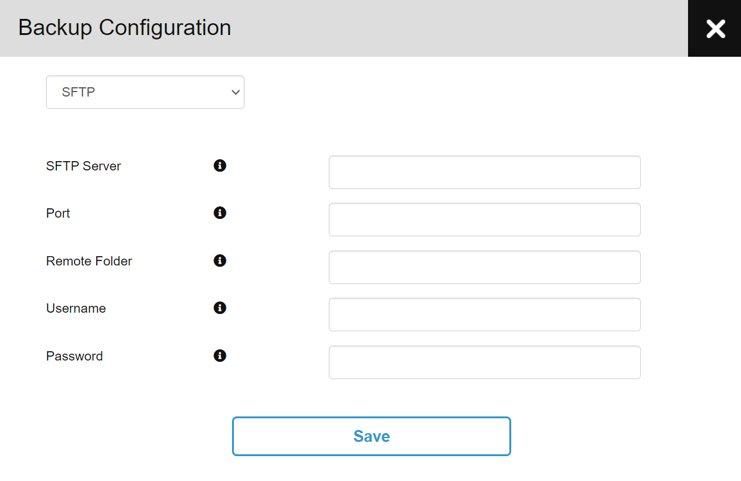
After pressing save if the configuration details are correct and the service is able to contact the backup destination, a notification will appear

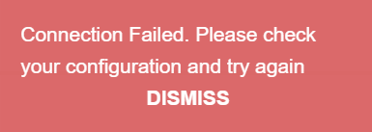
Otherwise you’ll get an error notification
After a successful connection message the configuration settings will be shown along with the following actions:
By pressing the Restore Backup Button you can see your available Backup Slots (maximum of 3). If there are already restored files, you can choose to view them (Event Viewer) or delete them to free the slot up (Empty Slot).
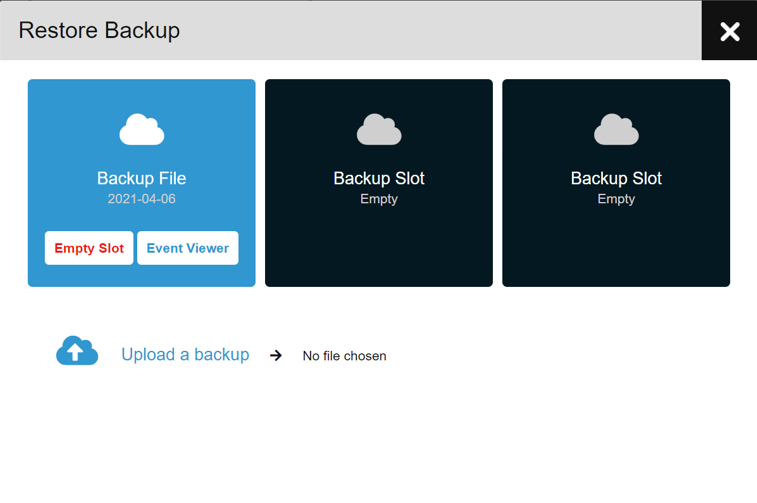
Uploading a backup file will start up a validation and restoration process. When it is complete you will be notified to access the restored index.
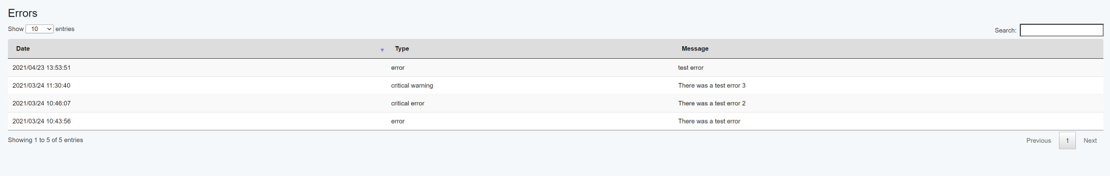
Every time an error is encountered during the Backup process (not enough space, connectivity issues etc) they will be logged in the Errors table:
This feature allows the definition of policies for installed software in the agents. A policy consists of a list of agents to be applied to, and a list of software that is either allowed, required of forbidden. The user has the option to list all software that is not explicitly mentioned in the list as forbidden.
Go to Admin -> Policy Monitor and create a new policy
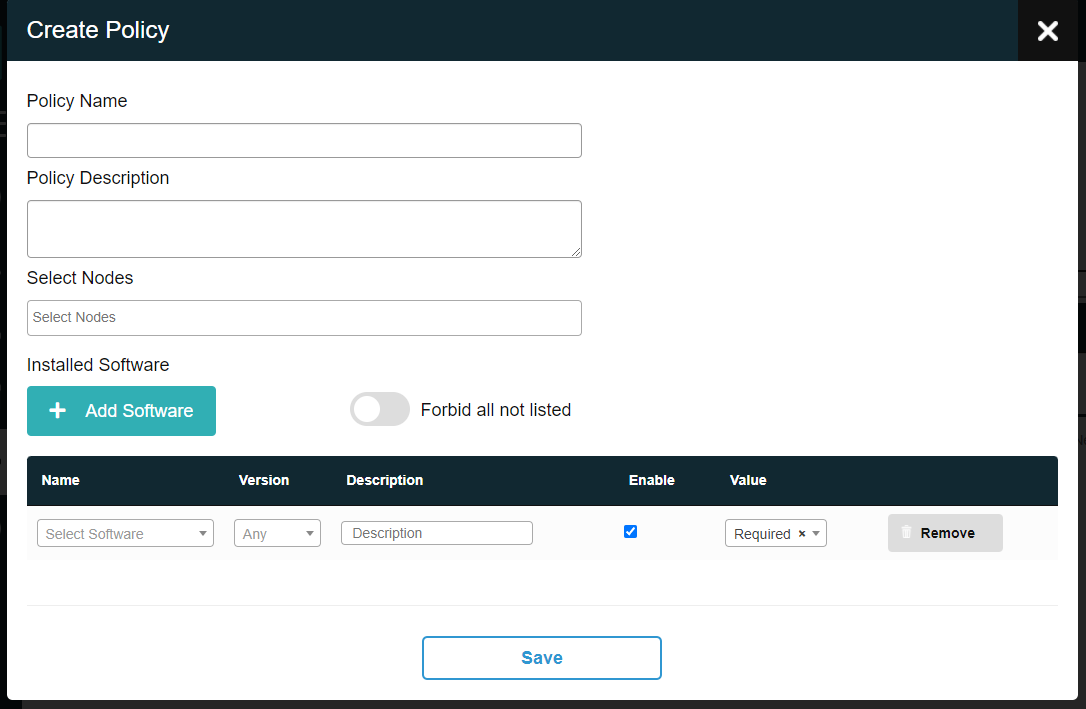
Policy monitor runs periodically (every 4 hours) and produces an alert violation event, if a policy violation is detected.
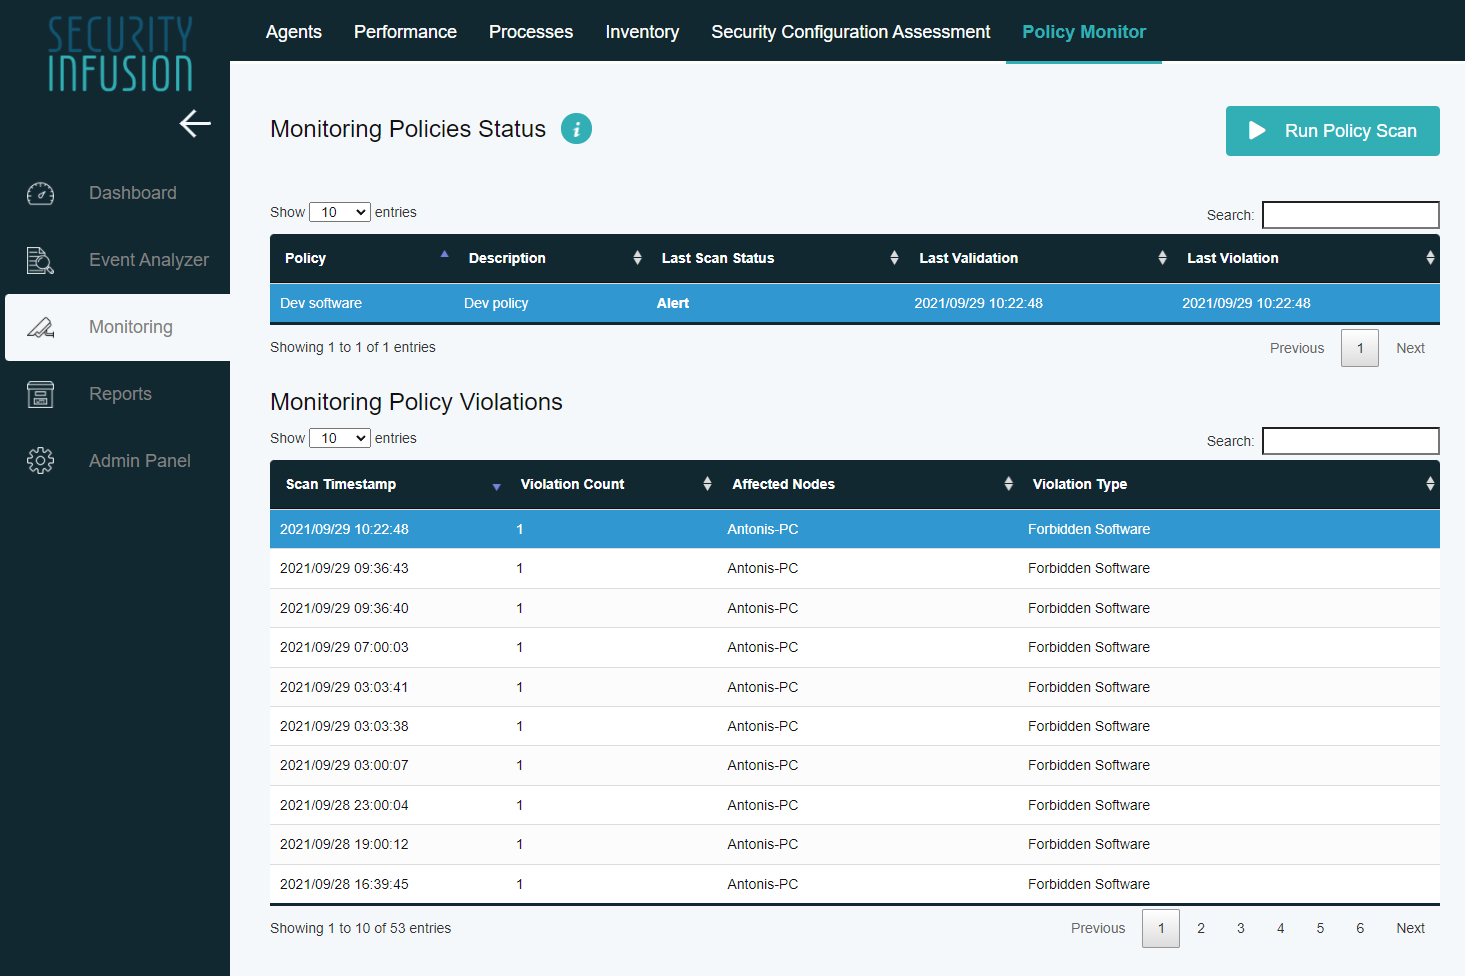
Go to Monitoring -> Policy Monitor to view all policies and policy violations.
The Master agent has the following functionalities:
Master Agent is open-source software that can be installed either by downloading a virtual machine (OVA file), compatible with virtualization software such as VMWare or Virtualbox. It can also be installed in a Centos 7 node, by using an installer.
| Minimum | Recommended | |
|---|---|---|
| OS | Centos 7 | Centos 7 |
| Platform | 32bit/64bit | 32bit/64bit |
| CPU | Intel i5 | Intel i5 |
| Memory | 4G | 4G |
Head to the admin page and “Master Agents” tab:
Press the “Create master agent” button and name your master agent (for this demonstration “test” is going to be used).:
Press the “Master agent details” button and then download the installer tarball. The installer is compatible only with Ubuntu Server 20.04 LTS. Untar the installer files and then execute the initialization script ( sudo ./installer.sh).:
After having installed and initialized the Master Agent node, you need to setup devices to send logs through remote syslog to the Master Agent. UDP Protocol is enabled by default in the Master Agent.:
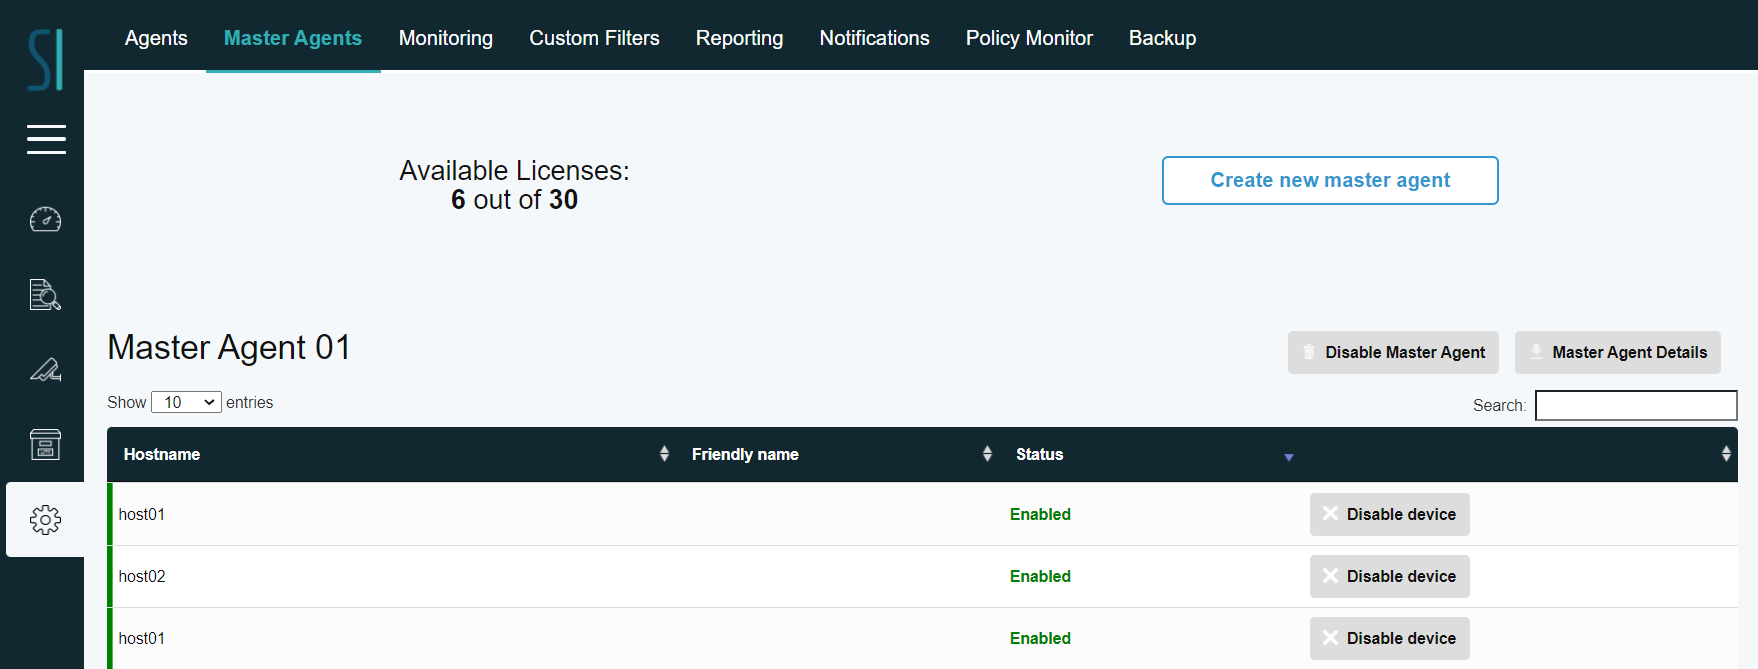
After a while (~10 minutes), you should be able to see the list of discovered devices ( devices that have sent syslog messages to the Master agent ) in the Master Agents tab in admin page.:
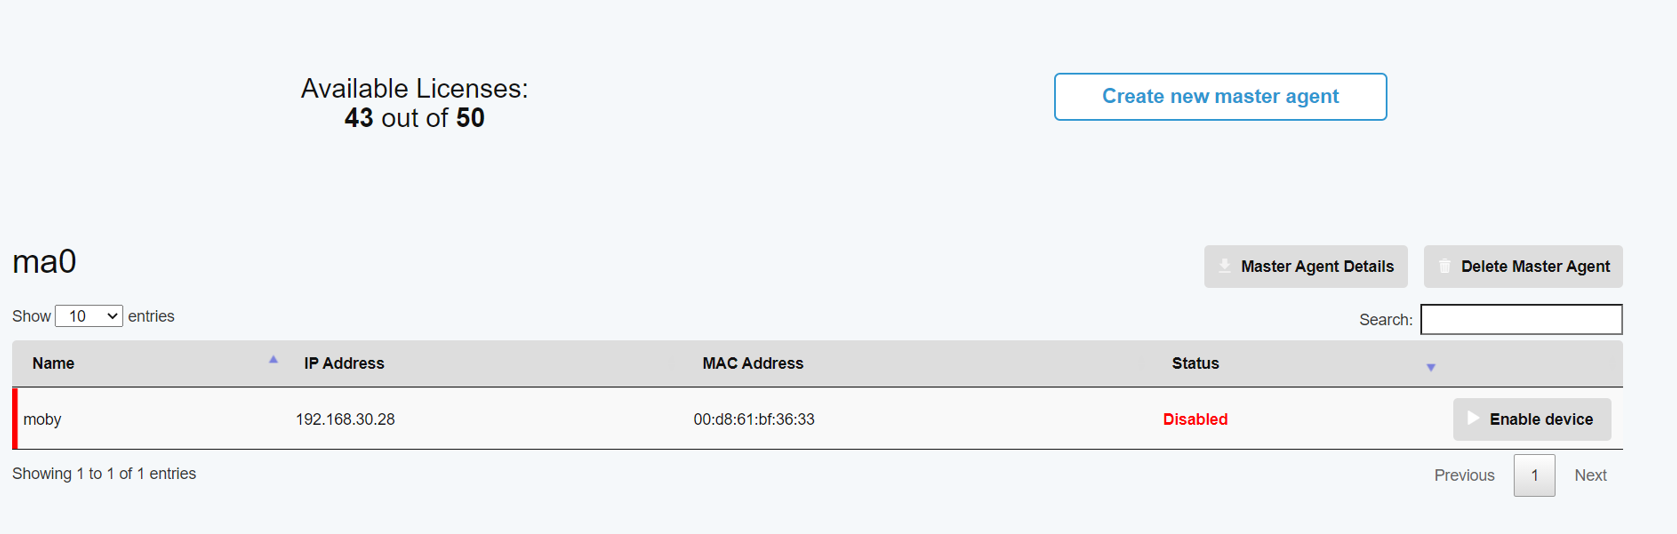
Press “Enable device” to enable monitoring of the device in the Manager. This will consume one of your available licenses. After enabling the device, you should be able to see events in the event viewer (after about ten minutes).:

The user can not remove agents that have been disabled so as to protect against data loss.
If the agent`s OS is Windows 7 check that Windows Management Framework 5.1 is installed.
There are two different services installed:
The monitored computer needs to have access to the internet and you need to allow outgoing traffic: